Kappa
“Great things are not done by impulse, but by a series of small things brought together.”
Hack The Box
Network Traffic Analysis
Network Traffic Analysis (NTA) can be described as the act of examining network traffic to characterize common ports and protocols utilized, establish a baseline for our environment, monitor and respond to threats, and ensure the greatest possible insight into our organization's network.
This process helps security specialists determine anomalies, including security threats in the network, early and effectively pinpoint threats. Network Traffic Analysis can also facilitate the process of meeting security guidelines. Attackers update their tactics frequently to avoid detection and leverage legitimate credentials with tools that most companies allow in their networks, making detection and, subsequently, response challenging for defenders. In such cases, Network Traffic Analysis can again prove helpful. Everyday use cases of NTA include:
- Collecting real-time traffic within the network to analyze upcoming threats.
- Setting a baseline for day-to-day network communications.
- Identifying and analyzing traffic from non-standard ports, suspicious hosts, and issues with networking protocols such as HTTP errors, problems with TCP, or other networking misconfigurations.
- Detecting malware on the wire, such as ransomware, exploits, and non-standard interactions.
- NTA is also useful when investigating past incidents and during threat hunting.
Try to picture a threat actor targeting and infiltrating our network. If they wish to breach the network, attackers must inevitably interact and communicate with our infrastructure. Network communication takes place over many different ports and protocols, all being utilized concurrently by employees, equipment, and customers. To spot malicious traffic, we would need to use our knowledge of typical network traffic within our enclave. Doing so will narrow down our search and help us quickly find and disrupt adversarial communication.
For example, if we detect many SYN packets on ports that we never (or rarely) utilize in our network, we can conclude that this is most likely someone trying to determine what ports are open on our hosts. Actions like this are typical markers of a portscan. Performing such an analysis and coming to such conclusions requires specific skills and knowledge.
Required Skills and Knowledge
The skills we are about to list and describe require theoretical and practical knowledge acquired over time. We do not have to know everything by heart, but we should know what to look for when certain aspects of the content seem unfamiliar. This applies not only to NTA but also to most other topics we will deal with in cybersecurity.
TCP/IP Stack & OSI Model
This understanding will ensure we grasp how networking traffic and the host applications interact.
Basic Network Concepts
Understanding what types of traffic we will see at each level includes an understanding of the individual layers that make up the TCP/IP and OSI model and the concepts of switching and routing. If we tap a network on a backbone link, we will see much more traffic than usual, and it will be vastly different from what we find tapping an office switch.
Common Ports and Protocols
Identifying standard ports and protocols quickly and having a functional understanding of how they communicate will ensure we can identify potentially malicious or malformed network traffic.
Concepts of IP Packets and the Sublayers
Foundational knowledge of how TCP and UDP communicate will, at a minimum, ensure we understand what we see or are searching for. TCP, for example, is stream-oriented and allows us to follow a conversation between hosts easily. UDP is quick but not concerned with completeness, so it would be harder to recreate something from this packet type.
Protocol Transport Encapsulation
Each layer will encapsulate the previous. Being able to read or dissect when this encapsulation changes will help us move through data quicker. It is easy to see hints based on encapsulation headers.
Environment and Equipment
The list below contains many different tools and equipment types that can be utilized to perform network traffic analysis. Each will provide a different way to capture or dissect the traffic. Some offer ways to copy and capture, while others read and ingest. This module will explore just a few of these (Wireshark and tcpdump mostly). Keep in mind these tools are not strictly geared for admins. Many of these can be used for malicious reasons as well.
Common Traffic Analysis Tools
- tcpdump - tcpdump is a command-line utility that, with the aid of LibPcap, captures and interprets network traffic from a network interface or capture file.
- Tshark - TShark is a network packet analyzer much like TCPDump. It will capture packets from a live network or read and decode from a file. It is the command-line variant of Wireshark.
- Wireshark - Wireshark is a graphical network traffic analyzer. It captures and decodes frames off the wire and allows for an in-depth look into the environment. It can run many different dissectors against the traffic to characterize the protocols and applications and provide insight into what is happening.
- NGrep - NGrep is a pattern-matching tool built to serve a similar function as grep for Linux distributions. The big difference is that it works with network traffic packets. NGrep understands how to read live traffic or traffic from a PCAP file and utilize regex expressions and BPF syntax. This tool shines best when used to debug traffic from protocols like HTTP and FTP.
- tcpick - tcpick is a command-line packet sniffer that specializes in tracking and reassembling TCP streams. The functionality to read a stream and reassemble it back to a file with tcpick is excellent.
- Network Taps - Taps (Gigamon, Niagra-taps) are devices capable of taking copies of network traffic and sending them to another place for analysis. These can be in-line or out of band. They can actively capture and analyze the traffic directly or passively by putting the original packet back on the wire as if nothing had changed.
- Networking Span Ports - Span Ports are a way to copy frames from layer two or three networking devices during egress or ingress processing and send them to a collection point. Often a port is mirrored to send those copies to a log server.
- Elastic Stack - The Elastic Stack is a culmination of tools that can take data from many sources, ingest the data, and visualize it, to enable searching and analysis of it.
- SIEMS - SIEMS (such as Splunk) are a central point in which data is analyzed and visualized. Alerting, forensic analysis, and day-to-day checks against the traffic are all use cases for a SIEM.
BPF Syntax
Many of the tools mentioned above have their syntax and commands to utilize, but one that is shared among them is Berkeley Packet Filter (BPF) syntax. This syntax is the primary method we will use. In essence, BPF is a technology that enables a raw interface to read and write from the Data-Link layer. With all this in mind, we care for BPF because of the filtering and decoding abilities it provides us. We will be utilizing BPF syntax through the module, so a basic understanding of how a BPF filter is set up can be helpful. For more information on BPF syntax, check out this reference.
Performing Network Traffic Analysis
Performing analysis can be as simple as watching live traffic roll by in our console or as complex as capturing data with a tap, sending it back to a SIEM for ingestion, and analyzing the pcap data for signatures and alerts related to common tactics and techniques.
At a minimum, to listen passively, we need to be connected to the network segment we wish to listen on. This is especially true in a switched environment where VLANS and switch ports will not forward traffic outside their broadcast domain. With that in mind, if we wish to capture traffic from a specific VLAN, our capture device should be connected to that same network. Devices like network taps, switch or router configurations like span ports, and port mirroring can allow us to get a copy of all traffic traversing a specific link, regardless of what network segment or destination it belongs to.
NTA Workflow
Traffic analysis is not an exact science. NTA can be a very dynamic process and is not a direct loop. It is greatly influenced by what we are looking for (network errors vs. malicious actions) and where we have visibility into our network. Performing traffic analysis can distill down to a few basic tenants.
NTA Workflow
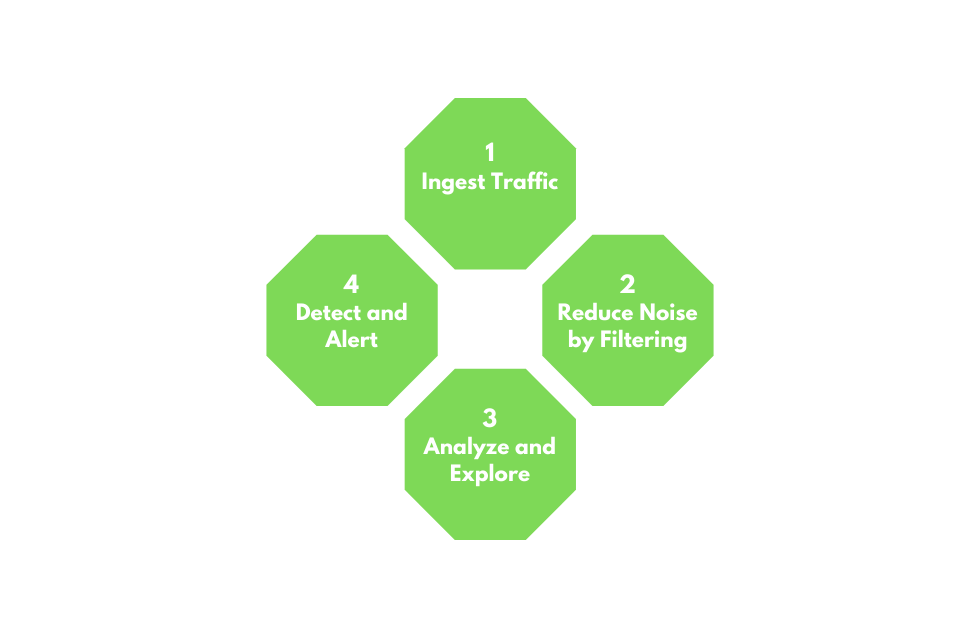
1. Ingest Traffic
Once we have decided on our placement, begin capturing traffic. Utilize capture filters if we already have an idea of what we are looking for.
2. Reduce Noise by Filtering
Capturing traffic of a link, especially one in a production environment, can be extremely noisy. Once we complete the initial capture, an attempt to filter out unnecessary traffic from our view can make analysis easier. (Broadcast and Multicast traffic, for example.)
3. Analyze and Explore
Now is the time to start carving out data pertinent to the issue we are chasing down. Look at specific hosts, protocols, even things as specific as flags set in the TCP header. The following questions will help us:
- Is the traffic encrypted or plain text? Should it be?
- Can we see users attempting to access resources to which they should not have access?
- Are different hosts talking to each other that typically do not?
4. Detect and Alert
- Are we seeing any errors? Is a device not responding that should be?
- Use our analysis to decide if what we see is benign or potentially malicious.
- Other tools like IDS and IPS can come in handy at this point. They can run heuristics and signatures against the traffic to determine if anything within is potentially malicious.
5. Fix and Monitor
Fix and monitor is not a part of the loop but should be included in any workflow we perform. If we make a change or fix an issue, we should continue to monitor the source for a time to determine if the issue has been resolved.